What is gene transcriptomics?
Transcriptomics is the technique used to study the RNA transcripts of an organism. This is made possible through two major techniques: microarrays and RNA sequencing. By comparing differences in expression between tissues, conditions, and time, we are able to study mechanisms underlying human disease as well as potential treatments (Lowe 2017). For years, the central dogma has been used as the basis of genetic and epigenetic study. Transciptomics allow us to take a closer look at the RNA portion of the central dogma and allows us to examine differences due to processes such as RNA splicing.
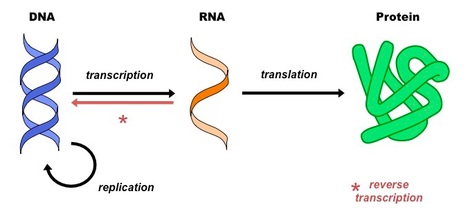
Central Dogma of of Biology
Microarrays
A microarray is a 2D array on a glass slide that allows a large amount of biological material to by analyzed. Different processes can be used to assay different types of samples including DNA, protein, tissue, peptide, etc. This technique allows us to quantify a set of sequences that we looking to study meaning that we are able to generate a profile of gene expression. From here we are able to determine protein levels in a given tissue and apply this to the study of the cellular function between different samples (Introduction 2017).

Microarray setup
RNA Sequencing
RNA sequencing, often referred to as RNA-Seq, uses next generation sequencing to quantify the RNA found in particular samples. Because the transcriptome is constantly changing, this method allows us to analyze the changes in spliced transcripts, post-translational modifications, gene fusion, and other differences in gene expression over time (Kukurba 2015).
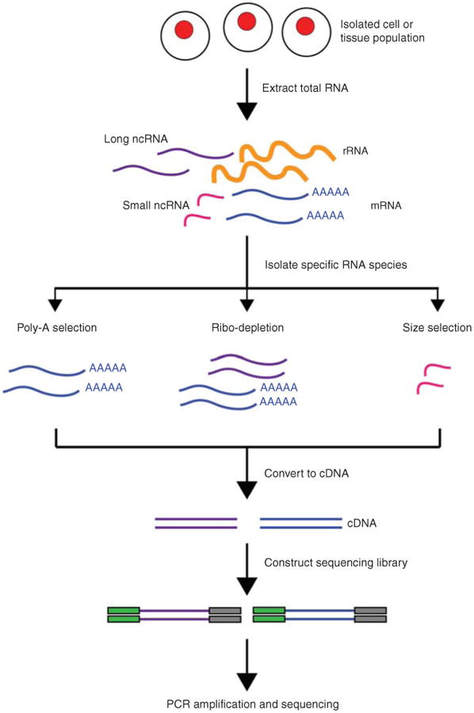
RNA-Seq set-up
What do we know about SHANK3 transcriptomics?
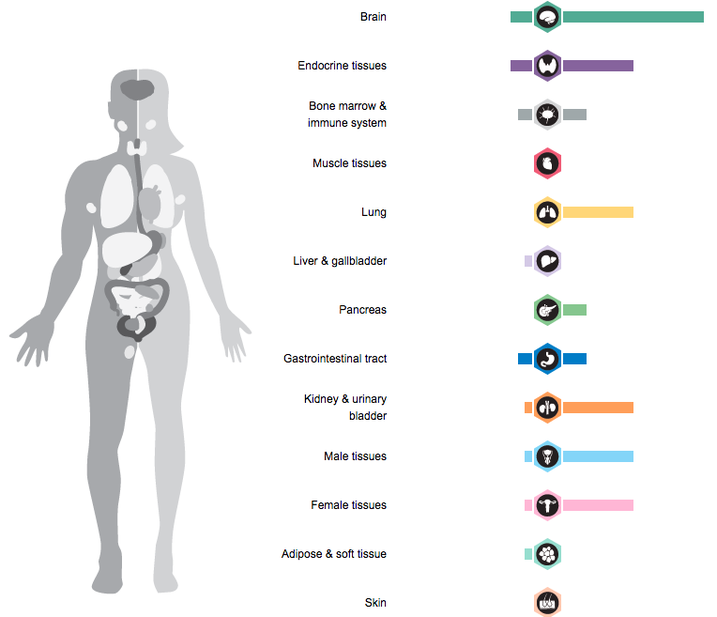
SHANK3 is most highly expressed in the brain but also plays a role in other systems throughout the human body as well.
Discussion
These transcriptomic techniques will prove to be incredibly useful in my study of the SHANK3 gene. RNA-Seq, specifically, has opened countless doors for epigenetic studies. RNA-Seq can offer diagnostic biomarkers of diseases and traits that do not necessarily appear at the level of the genome. By comparing the transcriptomes of individuals with various intellectual ability, I may be able to examine the ways in which SHANK3 expression varies in these individuals. Thus, understanding the differences in transcripts of individuals, I will aim to correlate the methylation of SHANK3 with varying intellectual ability (see Aim 2).
References:
Introduction to DNA Microarrays. (2015, December 30). Retrieved March 08, 2018, from https://bitesizebio.com/7206/introduction-to-dna-microarrays/
Kukurba, K. R., & Montgomery, S. B. (2015). RNA Sequencing and Analysis. Cold Spring Harbor Protocols, 2015(11), 951–969. http://doi.org/10.1101/pdb.top084970
Lowe, R., Shirley, N., Bleackley, M., Dolan, S., & Shafee, T. (2017). Transcriptomics technologies. PLoS Computational Biology, 13(5), e1005457. http://doi.org/10.1371/journal.pcbi.1005457
Header:
https://www.capturemonkey.com/gradientmap/
This web page was produced as an assignment for Genetics 564, an undergraduate capstone course at UW-Madison.
